

Kenshoo is a SaaS Marketing platform that helps clients efficiently and effectively manage their search engine and social marketing campaigns across the major online publishers (Google, Facebook, Instagram, Yahoo!).
Overview
After 6 years of failing fast and design as an after-thought, Kenshoo had developed a reputation for poor usability.
I launched a Global Client Survey to help the product and executive teams know exactly what the usability issues were, where to focus, and what to do in order to improve usability and regain their crown as the best Search and Social Marketing platform in the market.
resulted in a
+10% YOY improvement
in Usability & Client Satisfaction
objective
Implement recurring global client survey to:
Measure the current state of usability and client satisfaction
Present findings and recommendations to form a usability roadmap.
Improve usability and client satisfaction across Kenshoo’s suite of products overtime.
My Part
Quantitative Research
Qualitative Research
Survey Design
Survey Analysis
System Usability Scale (SUS)
UMUX-Lite
Descriptive Statistics
TEAM
User Researcher (me)
Directors of Product Growth
VP of Customer Growth
TIMELINE
3 months (kickoff to presentation)
BUT FIRST, A NOTE
To comply with my non-disclosure agreement, I have omitted and obfuscated confidential information and in particular the report findings in this case study. All information in this case study is my own and does not necessarily reflect the views of Kenshoo.
The Problem
Kenshoo had a usability problem.
In 2012, Forrester recognized both Kenshoo's Search and Social Marketing platforms as the “Sole Leader” in their categories. But years of failing fast, growing product sets, layered design, and disparate experiences had caught up to them.
Fast forward a mere 4 years later, there were grumbles of usability issues in Kenshoo-ville.
“ROI bidding is very poor, the interface is very user unfriendly and slow.
”
The challenge was to “fix” the allusive usability problem and return the crown to Kenshoo.
The term “usability” opens a Pandora’s Box of questions—what does “usability” mean to our clients or our senior leaders? Which part of the two different products was the “usability” culprit? In order to fix the problem, we first must define it.
The high-level project goals were to:
Understand and define the severity of the "usability" problem
Identify where within Kenshoo’s suite of products clients had the most issues
Understand not only what’s wrong with the products but also why
Set a baseline for future progress tracking
The Challenge
As the lone user researcher in Kenshoo, I led the research end-to-end: strategy, design, execution, analysis, and sharing findings.
While, Will Martin-Gill, the CPO at the time tasked me to understand just what the usability problem was and put together a plan to fix it. I realized that this was not something I could do in a vacuum. This research had depended on and had implications across Kenshoo’s organizations.
As such, I assembled a project team that consisted of key stakeholders in Product and Customer Success. Together with 2 Directors of Product Growth and the VP of Customer Growth, we defined the strategy and communication plan for the survey.
The project kicked off in May of 2016, lasted 3 months and then repeated every 6 months until my departure in March 2018.
My Role & Team
To understand the usability problem at scale, we started with a global client survey.
While a survey shouldn’t be taken as user research gospel, it would allow me to gather a larger data set and provide me a more definitive direction of where to focus.
Every project has its strings. Working with the project and leadership teams, I identified a few key constraints for the research:
Measurable. The Leadership team wanted concrete numbers.
Trackable. CS requested that all survey responses be tracked and tied to the customer record in SalesForce and Gainsight (their customer insights tool).
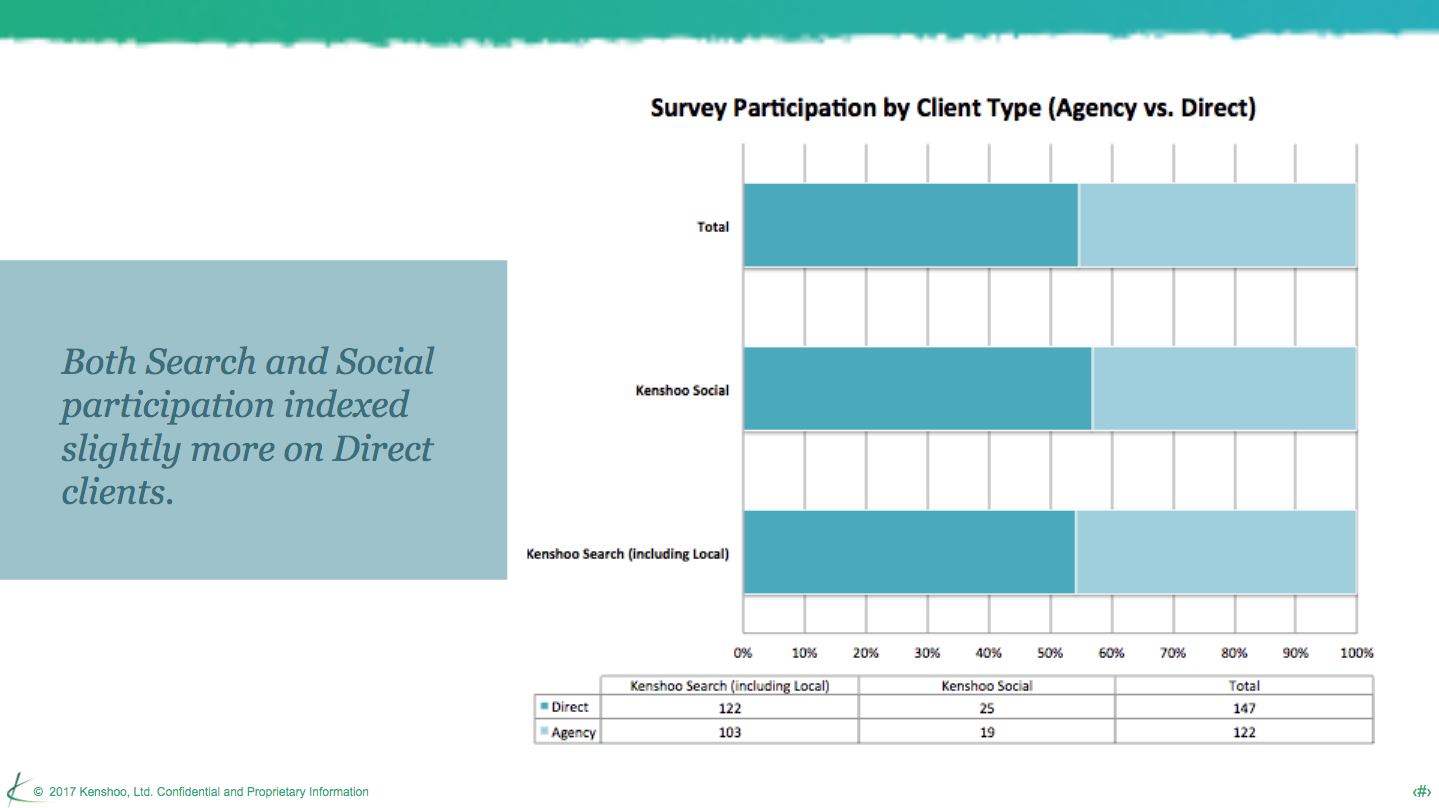
Segmentable. Teams wanted to be sure that findings could be analyzed by global market, product line, client type (agency vs advertiser), revenue level, industry.
Comparable. Leadership needed to be able to compare apples-to-apples between each of the product lines and over a period of time.
Contextual. Product team didn’t just want numbers, but wanted to know why people may have rated us in a particular way.
Scope & Constraints
There were a few unique gotchas that complicated the survey’s design and execution:
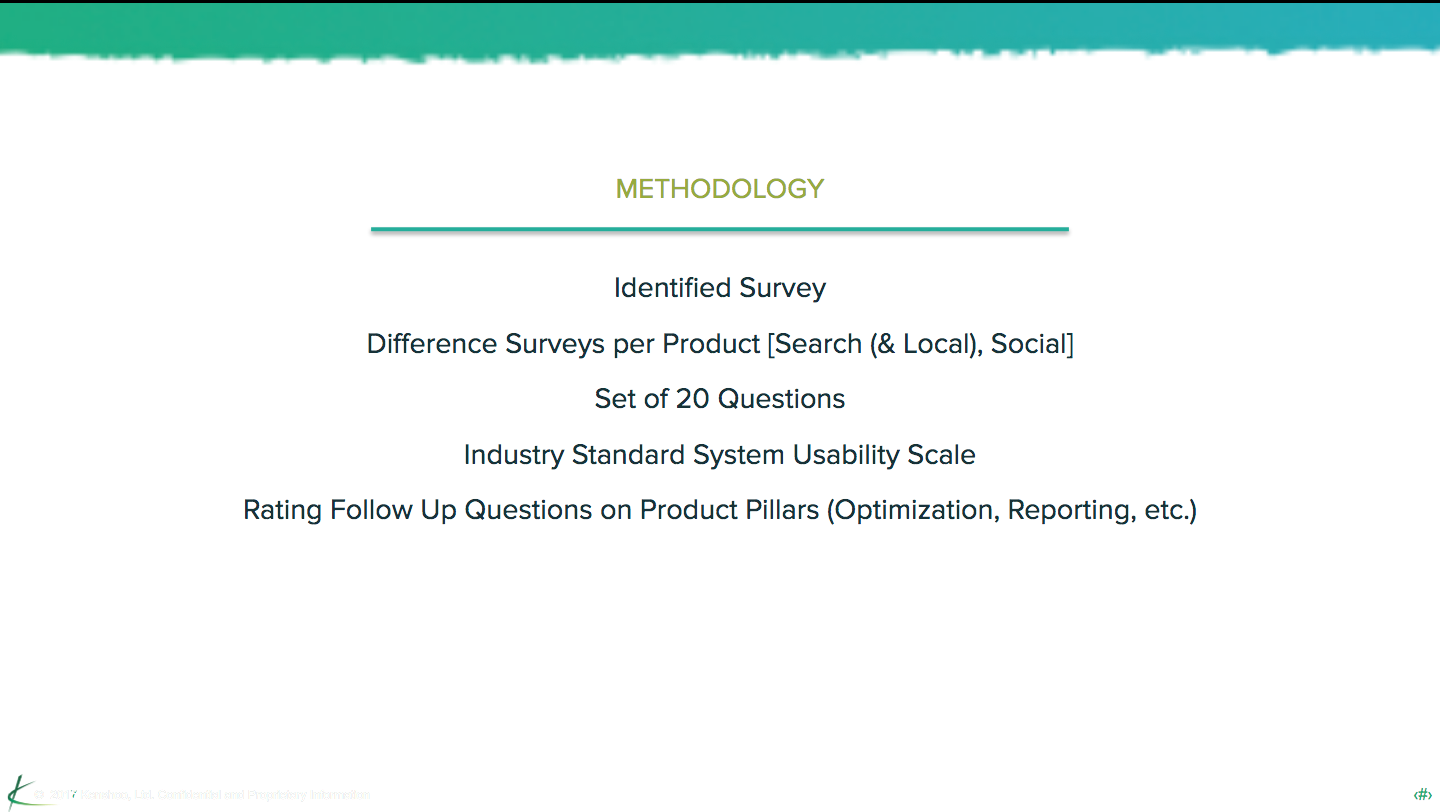
Multiple products
Kenshoo at the beginning two products—Kenshoo Search & Kenshoo Social. I had to be able to report independently on each product.
Complex features & functionality
As Kenshoo matured, so did the products. Both of its core products had multiple sections and features that differed by client type.
Global team & clients
Kenshoo’s product, design & engineering teams are mainly based out of Israel. Furthermore, Kenshoo operates in 185 countries with customer support across the world. I needed to account for different versions of the survey. I had to collaborate, coordinate and communicate internationally.
The Gotchas
There were two main “personas” for the research:
Research audience
Sponsored by the Chief Product Officer, the primary audience of the research was the Product Leadership and Executive teams. However, the research and findings had broader appeal across Product, Design, Marketing and Customer Success.
Survey participants
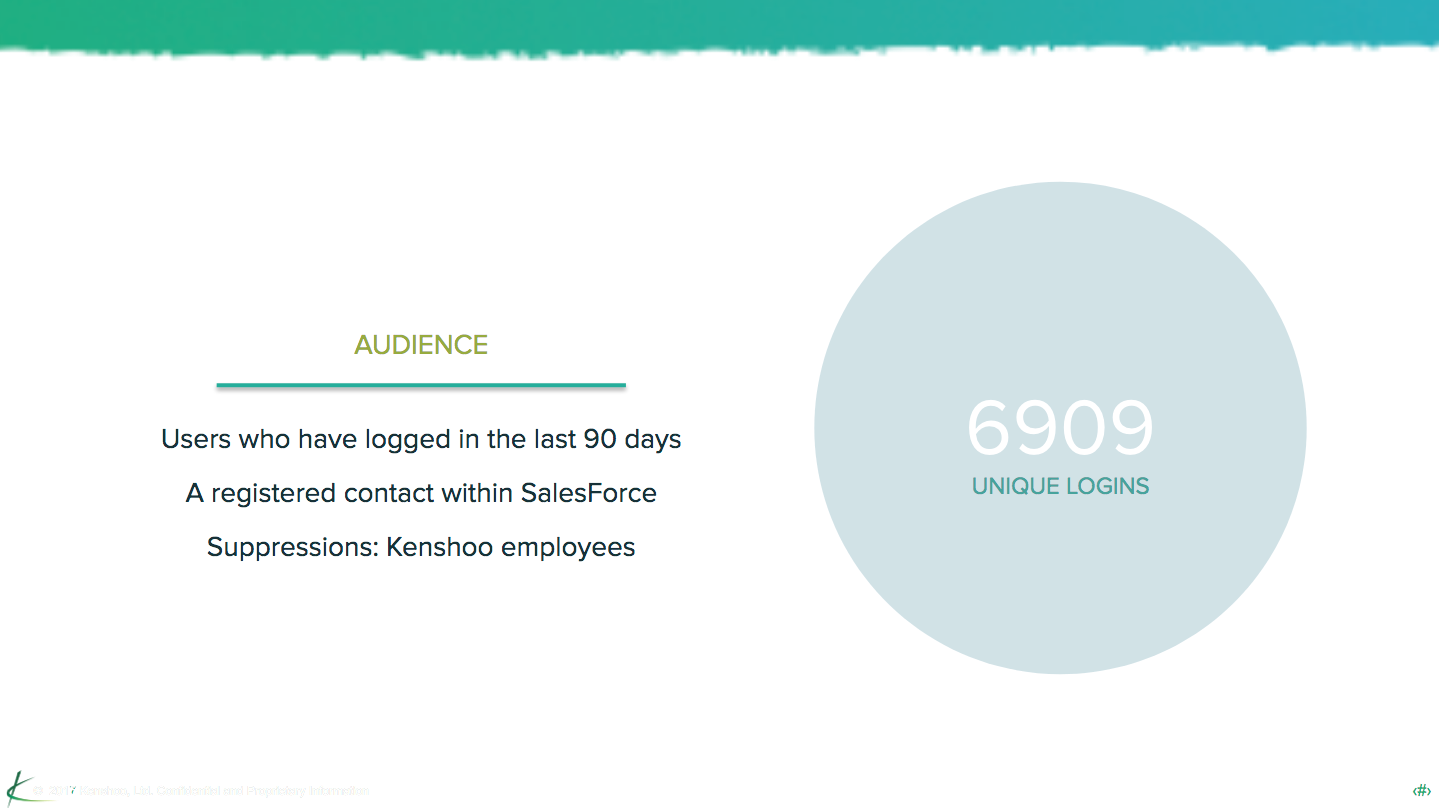
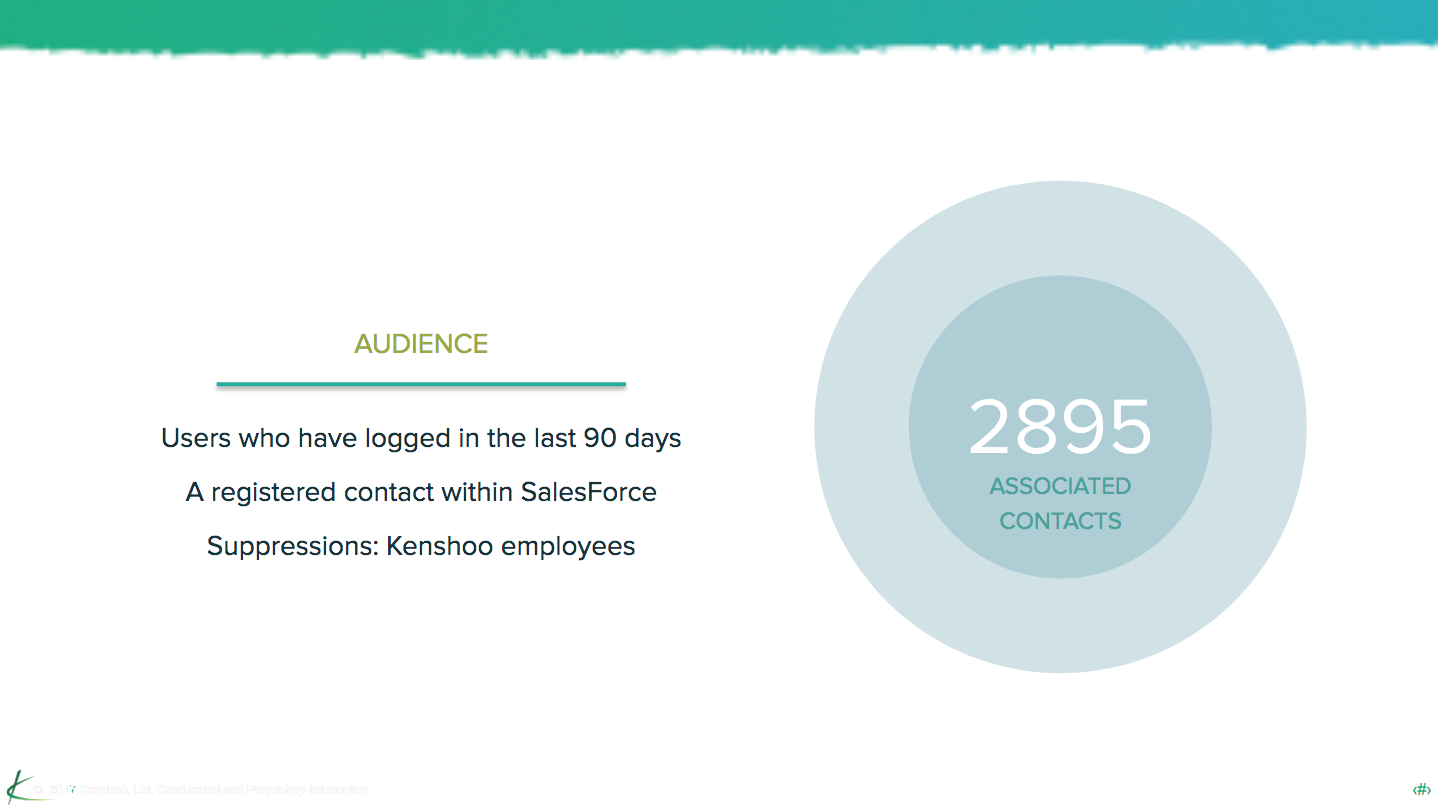
Those people we wanted to survey--our clients. To achieve statistical significance, we wanted to survey as much of the client base that was relevant. Since the focus was on usability and overall product satisfaction we focused on day-to-day users. We searched our data logs for clients that had logged into the platform in the past 90 days.
Who
I followed thIS 6 STEP process TO execute the survey.
What


The research plan was critical in driving consensus and accountability
DEFINE the research plan
Together with the project team, we outlined the research plan for the survey.
Articulating the what, why, who, how, and when, the research plan was critical in driving consensus and accountability among the project team as well as the larger organization.
For me the research plan is a living document. It starts as an outline and evolves as the project progresses to capture all information surrounding the project.
DESIGN THE SURVEY
With the research plan in place, I moved onto designing the survey. Given the goals, preliminary questions, assumptions, and constraints, I imagined what story I was hoping to tell at the end of the project. I wanted to be able to measurably say what was wrong but also provide context.
With that in mind, I designed a mixed method survey to balance the quantitative with the qualitative.
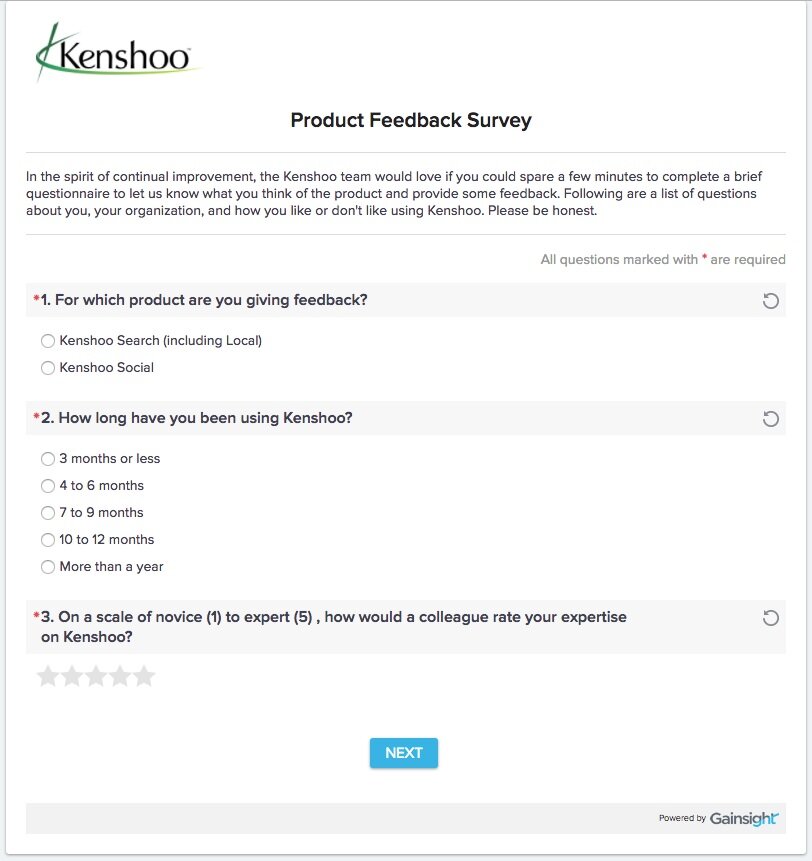
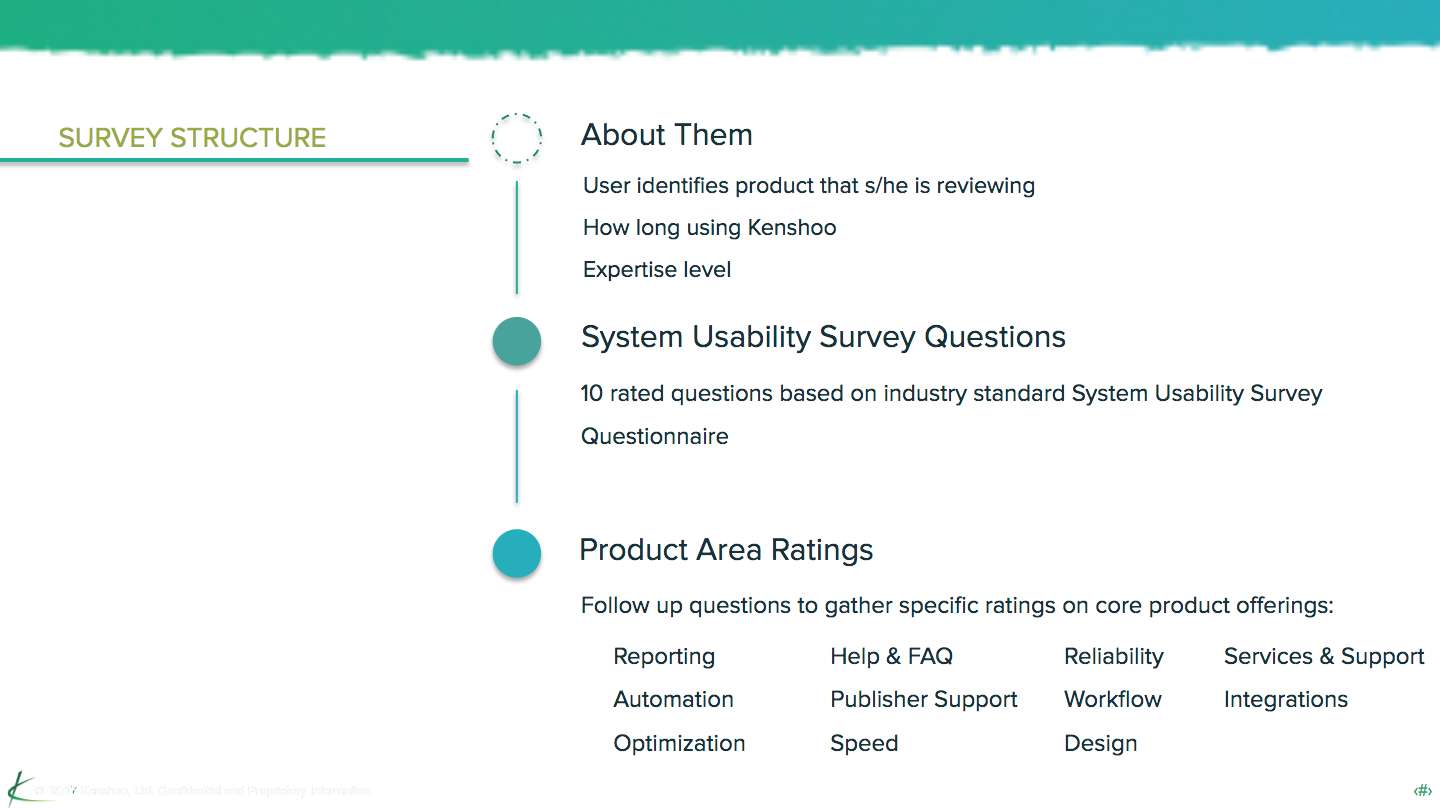
The survey into three main sections:
About them
A series of multiple choice questions to identify certain aspects of their Kenshoo product usage.
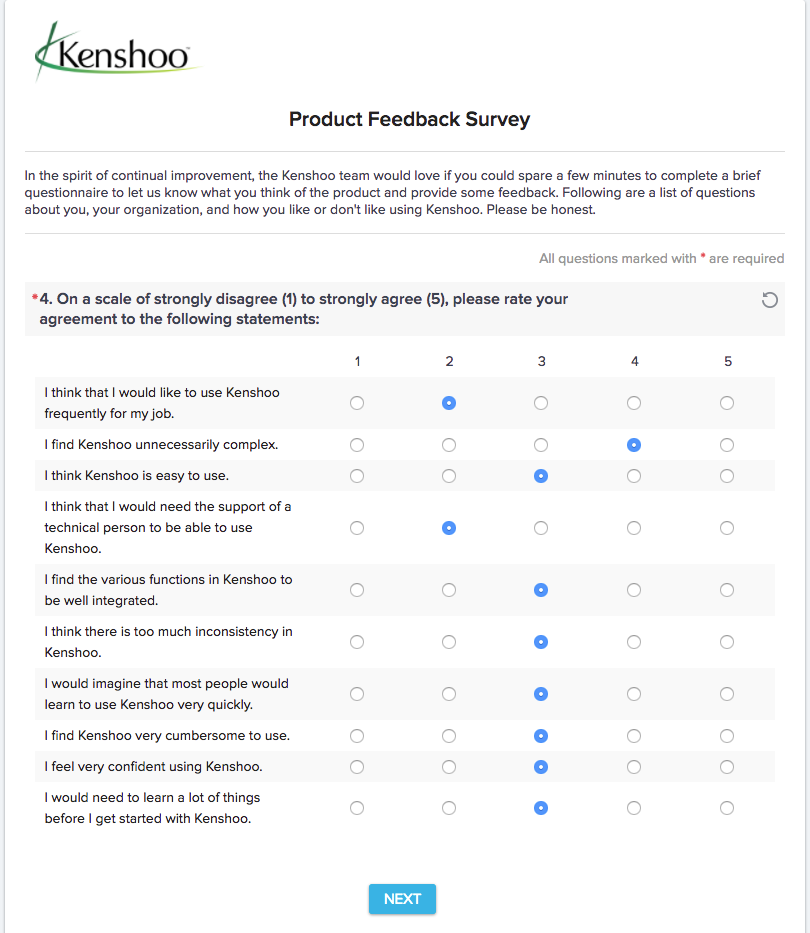
Usability Questions
A set of standardized questions based on the System Usability Scale (SUS) to define and quantify usability.
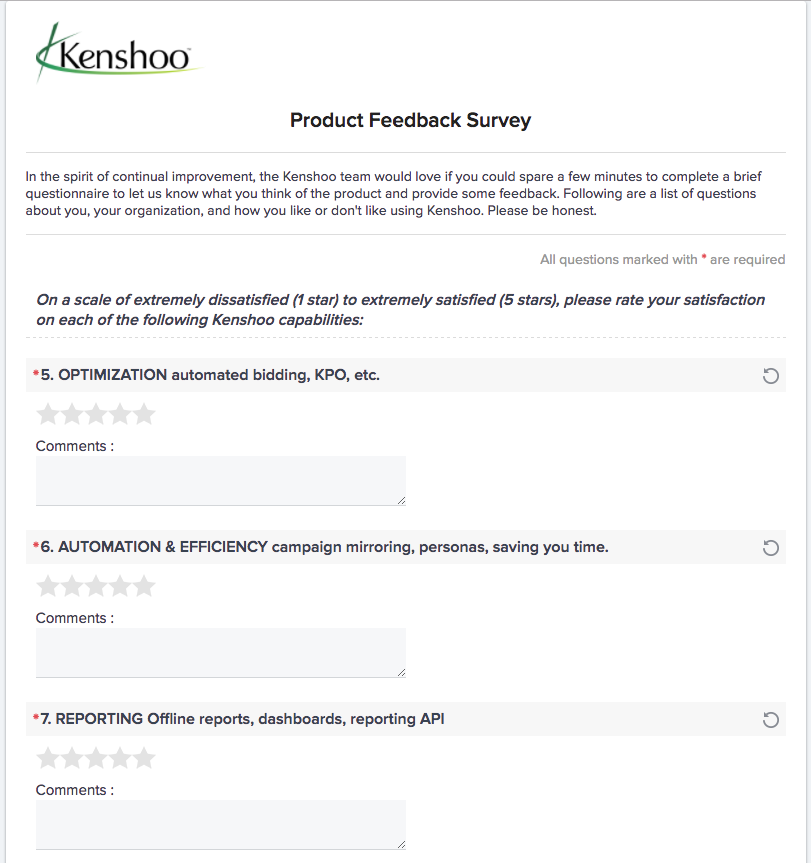
Experience Satisfaction
A set of rating and open-ended follow-up questions to derive clients’ satisfaction with key product & experience pillars (optimization, customer success, etc.).

Sample personalized invitation email from the December 2017 survey.
EXECUTE THE RESEARCH
Once the design and strategy was approved, I worked closely with the VP of Customer Growth on executing the survey. There was a couple of key steps that insured success:
Inform & coordinate with Customer Success Managers
Personalize emails
Integrate with SalesForce & Gainsight to track responses
Schedule survey reminders & follow-ups
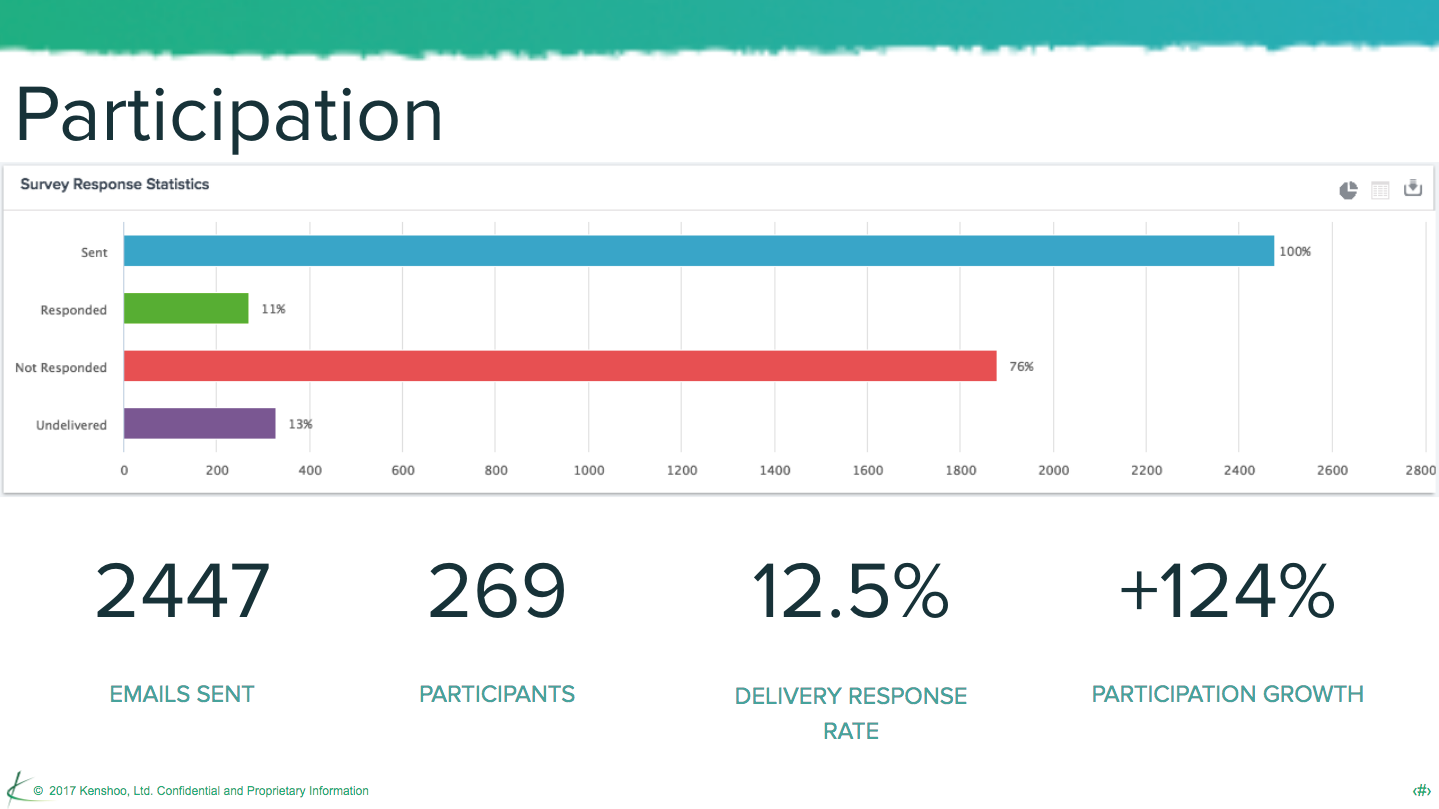
Through detailed targeting, personalization and reminders, I was able to increase our response rate from a dismal 8% via in-product pop-ups to 12.5%.
ANALYZE THE DATA
With the survey concluded, it was time to start crunching the numbers.
I interrogated the data through a series of analyses—testing for validity and interesting insights. :
Cleanse the data, looking for incomplete and partial responses
Calculated Usability (SUS) & Satisfaction scores
Complemented with external data to get a clearer picture
Coded open-ended questions for better analysis
Cross-tabulated segments like product, region, perceived expertise, etc
Calculated confidence intervals per group & sub-segment
Compared subgroups through 2 sample t-tests

I utilized Jeff Sauro’s System Usability Scale (SUS) calculator package to perform a majority of the analyses.
DEDUCE the findings
With the weeks spent analyzing the survey responses and gathering additional information from CS, Sales & Product teams, a clearer picture started to come into focus.
Here are just a few of the findings that emerged from the data.
Newbies aren’t happy.
People who rated themselves as experts were on average rated Kenshoo +20 pts higher on Usability and Satisfaction.
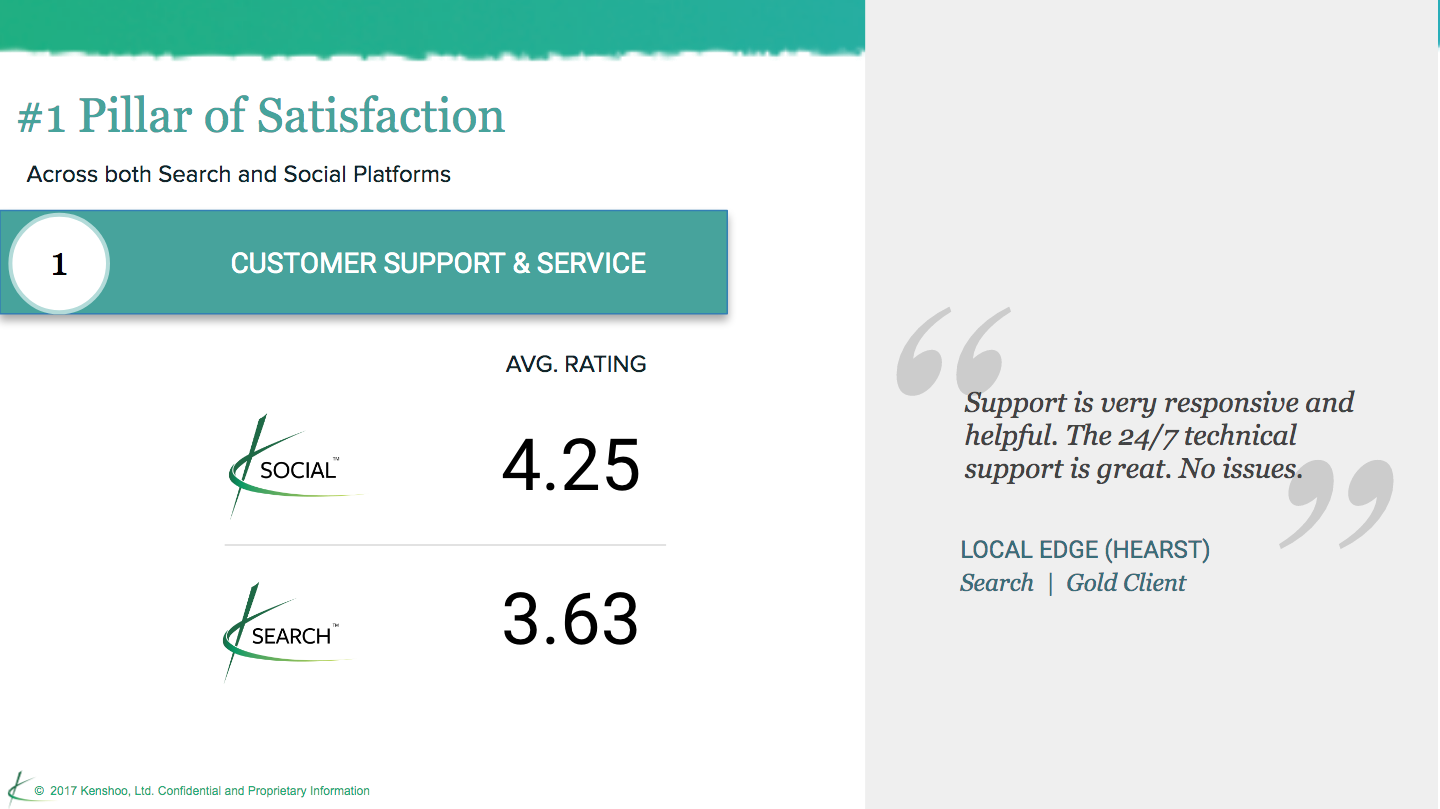
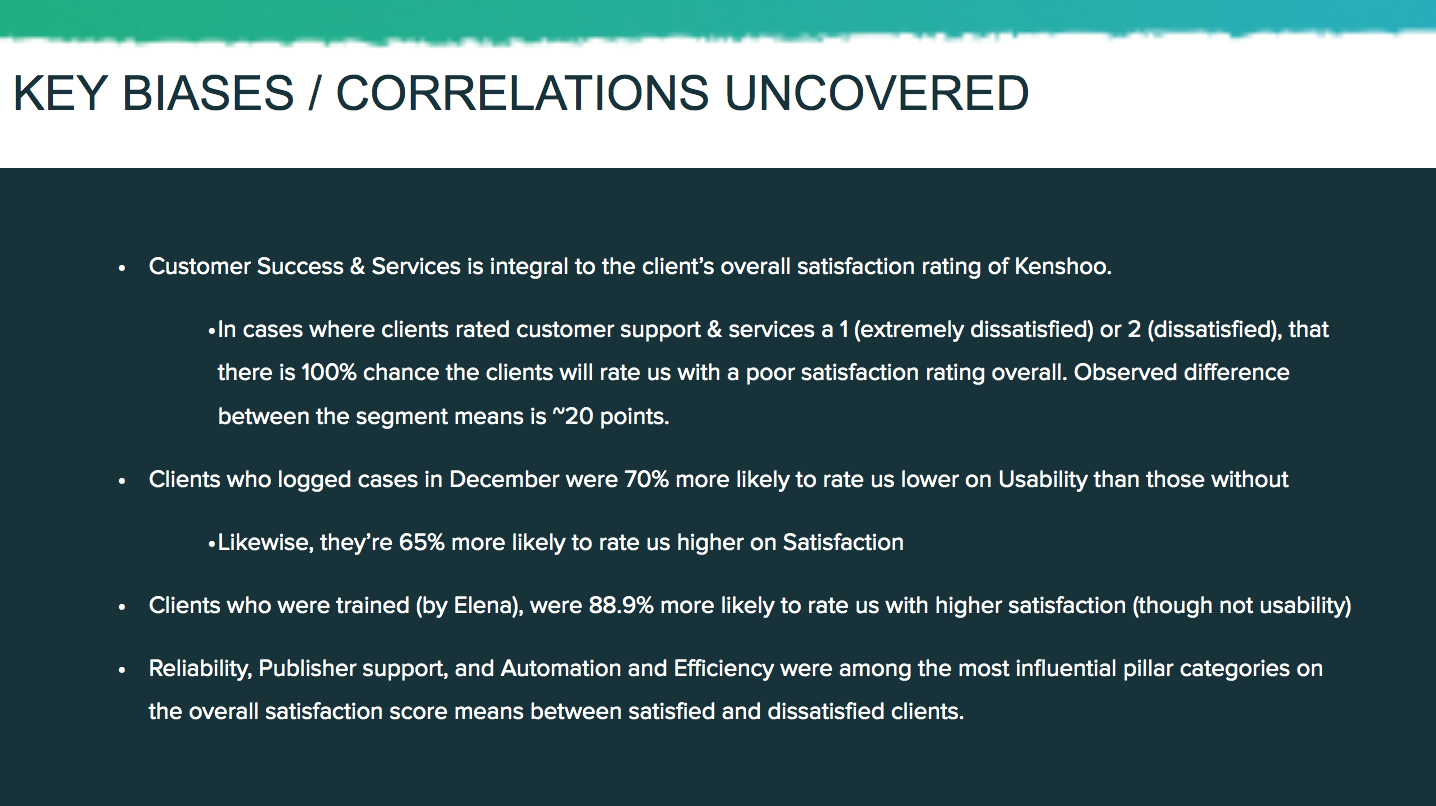
Customer Success & Services is integral to the client’s overall satisfaction rating of Kenshoo.
In cases where clients rated customer support & services a 1 (extremely dissatisfied) or 2 (dissatisfied), that there is 100% chance the clients will rate us with a poor satisfaction rating overall.
Client Training has a large impact on overall satisfaction, but not usability.
Clients who were trained, were 90% more likely to rate us with higher on experience satisfaction. Although, not on usability.
Reliability, Publisher Support, and Automation and Efficiency pillars weighed the most on product satisfaction.
Note: for confidentiality, I’ve omitted some of the data conclusions and findings.
Share the Findings
Finally, I circulated the report and findings—starting first with the project team and working outwards throughout the organization.
I worked with the individual product owners to craft a more complete story—not just focusing on what was wrong, but also what we were going to do about it. Armed with this story, I presented the findings and next steps to the Executive Team, CS global teams, and the wider organization.
For transparency, I made all data, analysis, and information available for all teams to use and analyze at their own discretion.
Note: for confidentiality, I’ve omitted some of the data conclusions and findings.

The Results
We improved Kenshoo’s usability & overall client satisfaction scores by 10% year OVER year.
In addition, we:
Developed a company-wide success metrics for measuring usability and customer satisfaction
Developed an understanding of the biggest usability issues/areas that we can follow up with a deeper usability study
Spawned subsequent user research and usability studies
Integrated findings into product roadmaps
Initiated a schedule for repeated measurement and progress tracking
The Learnings
Test. Measure. Learn. Repeat.
With every survey cycle I tested delivery methods, email communication, and questions. The survey evolved to respond to changing business and client needs.
Here are just some of tips & insights I learned over the 6 cycles spent testing and analyzing the survey:
Email > Pop-ups. We tested email against in-product popups. Emails had significantly higher participation (+126%).
Shorter is better. To combat that, we found ways to shorten the survey. Adopting the UMUX-lite model boosted response rates by 2%.
Donate to a Charity! Non-monetary incentivization (donation to a charity) boosted response rates by 4%.